Variations
What prints with the starting settings
| Paper | A4 — 210 × 297 mm (8.27 × 11.69 in) |
|---|---|
| Square size | 2 mm = 0.079″ |
| Squares per inch | 12.7 |
| Squares per cm | 5 |
| Grid on this page | 95 × 138 squares |
| Margins | 10 mm |
| Line weight | 0.18 mm (bold 0.35 mm) |
| Print setting | Scale 100% / Actual size |
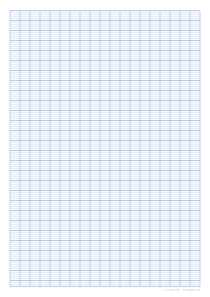
A metric grid for precise plotting
When a school science course asks for “graph paper”, it usually means a fine metric grid with heavier centimeter lines. The 2 mm version is a practical middle ground: five squares per centimeter is detailed enough to plot results to two significant figures, yet the lines are far enough apart that a pencil cross still lands clearly inside a square.
On A4 the grid runs 95 squares across and 138 down, so a full page offers 19 centimeters of horizontal axis. That is enough for a temperature reading every minute for more than an hour and a half at one square per minute.
Choosing a scale that reads easily
Good lab graphs use most of the page. Look at the range of your data, divide by the number of bold centimeters available, and round up to a friendly value: 1, 2 or 5 units per centimeter (or 10, 20, 50). With five small squares per centimeter, those scales give clean values for every line, so you never have to plot at awkward thirds. Label each axis with the quantity and unit before you plot the first point.
If your data covers several orders of magnitude, such as bacterial growth or sound intensity, a linear grid will crush the early points. Switch to log graph paper instead.
Other uses for a fine grid
- Pattern drafting at reduced scale, where each centimeter represents 10 cm of fabric.
- Pixel and bead designs that need a high count on one page.
- Engineering sketches of small parts, drawn 1:1 and measured straight off the grid.
- Site and room plans at 1:50, where each bold block is half a meter.
Printing tips
Fine lines need a clean printer. Print the vector PDF rather than an image, and choose Actual size in the dialog. Ten bold blocks should measure 100 mm exactly. For long experiments the A3 landscape variation gives a 400 mm axis, as long as your printer takes A3 sheets. If the lines print too faint to see, raise the line weight slightly in Advanced options instead of darkening the color, which keeps the bold centimeter lines distinct.
More graph paper sheets
- 1/4 inch graph paper (Letter & A4)
- 5 mm graph paper (A4, Letter & A3)
- 1/8 inch graph paper (Letter, A4 & Legal)
- 1 cm graph paper (centimeter squares)
- Engineering paper (5 squares per inch)
- 1 inch graph paper (Letter, A4 & 11×17)
- A4 graph paper (5 mm, 1 cm, 2 mm & more)
- 1/2 inch graph paper (large squares)
- 1 mm graph paper (millimetre paper)
- 11×17 graph paper (Tabloid & Ledger)
- A3 graph paper for large drawings and plans
- Quilting graph paper
- Legal size graph paper (8.5 × 14 in)
Frequently asked questions
How many 2 mm squares are on an A4 page?
With 10 mm margins the A4 grid is 95 × 138 squares, which is 19 × 27.6 centimeters of plotting area. Letter gives 95 × 127, and A3 gives 138 × 200.
Why 2 mm instead of 1 mm graph paper?
Millimeter paper has ten lines per centimeter and can be tiring to read, especially from a home printer. A 2 mm grid keeps five lines per centimeter, so you can still plot to the nearest 0.2 cm and estimate halfway between lines for 0.1 cm.
What is each small square worth on a graph?
Pick a value for each bold centimeter first, such as 1, 2, 5 or 10 units. Each small square is then one fifth of that: 0.2, 0.4, 1 or 2 units. Scales based on 1, 2 and 5 make plotting easiest.
Can I print 1 mm paper instead?
Yes. Set the square size to 1 mm in the generator and Bold line every to 10. On A3 this gives 277 × 400 squares. Expect it to look grey from a distance; the 2 mm version is easier on the eyes.
Which line color is best for scanning or photocopying?
Pale orange or light blue lines tend to fade in black-and-white copies while your pencil marks stay dark, which is useful when you only want the plotted data to show.
Last updated · About us