Daily and yearly Gantt chart templates
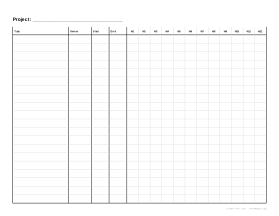
The default above is a 12-week chart for most projects. These setups switch the timeline to days for a one-month plan or to months for a whole year.
30-day Gantt chart (daily, 31 day columns)
A day-by-day chart for one month, with 31 narrow day columns to cover the longest month and 25 task rows on a landscape page. For events, launches and short projects where every day counts.
12-month Gantt chart (yearly project plan)
Twelve month columns, numbered M1 to M12 so the year can start in any month, and 20 task rows on a landscape page, for annual plans, roadmaps and long projects.
What prints with the starting settings
| Paper | US Letter — 279.4 × 215.9 mm (11 × 8.5 in), landscape |
|---|---|
| Timeline | 12 weeks |
| Task rows | 20 |
| Margins | 1/2″ |
| Line weight | 0.18 mm (bold 0.35 mm) |
| Print setting | Scale 100% / Actual size |
Planning on paper
Gantt charts are named after Henry Gantt, who popularised them in the early twentieth century. They are still the clearest way to show a schedule: one row per task, one column per period, bars for the time each task takes. Drawing one by hand is often the fastest way to find out whether a plan actually fits the time available.
Every chart has a Project line at the top and Task, Owner, Start and End columns on the left. The timeline columns are labelled W1, W2… for weeks, M1, M2… for months, and 1, 2, 3… for days, so you can write the real dates above them.
Days, weeks or months
| Timeline | Columns | Good for |
|---|---|---|
| Days | 31 for a month (30-day chart), 14 for a two-week sprint | Events, launches, house moves, sprints |
| Weeks | 12 by default, up to 52 | Most projects, school projects |
| Months | 12 for a year (12-month chart), 18 for longer projects | Annual plans, roadmaps, project phases |
All three units take 4 to 52 periods and 5 to 40 task rows.
30-day Gantt chart: every day on one line
Short projects such as an event, a product launch, a house move or a school project often fail on the small details: something that should have been ordered a week earlier, two tasks needing the same person on the same day. A daily Gantt chart puts every task on a timeline you can read at a glance.
To plan an event, work backwards:
- Write the event day in the last column you need.
- Ask what has to be finished the day before, the week before, two weeks before.
- Draw a bar for each task ending on its deadline.
- Look down each column for days that are overloaded and move tasks earlier.
Each day, shade the bars for work that was done and circle anything that slipped. Today’s column shows what should be happening now, and anything to the left that isn’t shaded is late.
Weekly Gantt chart
Weeks are the right resolution for most projects: twelve columns suit a school project or any plan of about three months, and a landscape page still leaves room for task names. Add columns, up to 52, for a project that runs most of a year week by week.
12-month Gantt chart: the year as a timeline
A month-by-month chart shows how the pieces of a long project fit together: which phases overlap, when the busy periods are, and what has to finish before something else can start. With the whole year visible on one page, it is a good tool for planning meetings and for pinning above a desk. List phases rather than single jobs (research, design, build, test, launch, review) and set 18 periods for projects that run past one year, or 30 rows for a more detailed plan.
It is not only for work:
- School year: units, exams and coursework deadlines.
- Personal goals: a training plan for a marathon or a savings plan for a big purchase.
- Home projects: renovation phases from planning permission to decorating.
- Gardens: sowing, planting and harvest windows for each crop.
For a long project, plan the phases on the 12-month chart and use the 30-day chart for the busiest month.
How to draw a useful chart
- List the tasks in the order they happen.
- Write each task’s owner and planned start and end.
- Draw a bar across the periods for each task in pencil.
- Mark milestones with a diamond and dependencies with small arrows from one bar’s end to the next bar’s start.
- Colour in the bars with pen as tasks are completed, so planned and actual progress are easy to tell apart.
The Gantt chart planning guide walks through a whole project. Daily task lists can live on a to-do list, dates on the yearly calendar, and figures by month on 12-column paper.
Printing tips
Print at 100% / Actual size in landscape on Letter or A4. For a wall chart, choose Tabloid (11 × 17 in) or A3.
Frequently asked questions
What is a Gantt chart?
A bar chart of a project schedule. Each task is a row, time runs left to right, and a horizontal bar shows when each task starts and ends, so overlaps and dependencies are easy to see.
Can I choose days, weeks or months?
Yes. Pick the timeline unit and the number of periods, from 4 to 52: for example 12 weeks for a school project, 31 days for a one-month daily plan or 12 months for a yearly plan.
How many tasks fit?
From 5 to 40 rows. Twenty rows on a landscape page leaves comfortable room to write task names; the daily chart uses 25. Fewer rows make each one taller if you want to write task details.
What are the Owner, Start and End columns for?
Who is responsible for the task and its planned dates. Filling them in turns the chart into a simple project plan that can be shared on a wall.
Why does the 30-day chart have 31 columns?
So it covers the longest month. For shorter months or a 30-day challenge, leave the last column empty. Write the date above each column and shade weekends to see the working days at a glance.
Is a daily Gantt chart good for agile sprints?
Yes. Set the daily chart to 14 periods for a typical two-week sprint, which also makes each day column wider, and list the stories or tasks down the side.
Can a 12-month chart cover a school or financial year?
Yes. The month columns are numbered rather than named, so M1 can be September for a school year, April for a UK tax year or any month you like. Write the month names above the numbers.
How detailed should a yearly plan be?
At month resolution, aim for phases and major tasks rather than individual jobs. Break a busy month down further on a 30-day Gantt chart.
How do I show milestones and dependencies?
A common convention is a small diamond in the period where the milestone falls, instead of a bar, and an arrow from the end of one bar to the start of the task that depends on it.
Why use a paper Gantt chart?
For early planning, workshops and small projects, drawing bars by hand is quick and easy to discuss as a group. Software is better for large projects that change often.
Last updated · About us