What prints with the starting settings
| Paper | US Letter — 215.9 × 279.4 mm (8.5 × 11 in) |
|---|---|
| Margins | 1/2″ |
| Line weight | 0.18 mm (bold 0.35 mm) |
| Print setting | Scale 100% / Actual size |
What log graph paper is used for
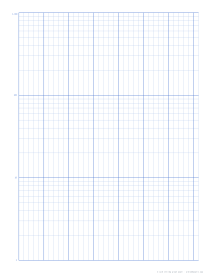
On ordinary graph paper the distance between 1 and 2 is the same as between 101 and 102. On logarithmic paper, equal distances represent equal ratios: the gap from 1 to 10 is the same as from 10 to 100 or 100 to 1,000. That makes it possible to plot values that range over several powers of ten on a single page, and it straightens curves that would otherwise bend off the chart.
Science and engineering students use it in labs for radioactive decay, bacterial growth, RC circuit discharge, sound levels and frequency response. Electronics engineers sketch Bode plots, where frequency runs across several decades. Geologists and soil engineers plot grain-size distributions. Economists and investors chart long-run growth, where a constant percentage increase appears as a straight line. Teachers use it to show students why a logarithmic scale exists in the first place.
Semi-log or log-log
Choose semi-log paper when one quantity changes by a constant factor for each equal step in the other, such as population over time or charge over seconds. Plot time on the linear axis and the changing quantity on the log axis. If the points fall on a straight line, the relationship is exponential, and the slope gives you the growth or decay rate.
Choose log-log paper when you suspect a power law, such as y = kxⁿ. On log-log paper that relationship becomes a straight line, and its slope measured with a ruler is the exponent n. Pendulum periods, planetary orbits and many scaling laws in biology are classic examples.
Choosing the number of cycles
The generator offers 1 to 5 cycles on the vertical axis, and either a linear axis or 1 to 5 log cycles horizontally. On a Letter page:
- 1–2 cycles give the most room per decade and are easiest to read precisely. Good for school labs where data spans one or two orders of magnitude. See 2-cycle log paper.
- 3 cycles (the default) suit most experiments and are the most common semi-log paper.
- 4–5 cycles cover very wide ranges, such as frequencies from 10 Hz to 100 kHz, but each decade is compressed.
Reading and plotting tips
- Label the bottom of each axis with the power of ten just below your smallest value, then label each bold decade line from there.
- The intermediate lines are 2, 3, 4 … 9 times the decade value. The line marked 5 sits a little past the middle of the cycle, since log 5 is about 0.7.
- To find a slope on log-log paper, measure the rise and run with a ruler in millimeters, not in data units, and divide each by the length of one cycle on its own axis. The ratio of the two results is the exponent.
- Draw your best-fit line through the points rather than connecting them, then read values off the line.
Setting it up in the generator
Select Log & semi-log paper as the paper type and your paper size. Choose the number of vertical log cycles, then set the horizontal axis to Linear (semi-log) or to a number of log cycles for log-log paper. On semi-log sheets you can set the linear division in millimeters or inches. Switch decade labels on or off, and use landscape orientation if your linear axis is time and you need more of it.
In Advanced options, the line color and weight help readability: bold decade lines in a darker shade make the cycles easy to find. Add a title and header fields such as Name, Class and Date for lab reports.
Printing tips
Print at Actual size so the cycle length on the page matches the PDF; this matters most on log-log paper, where you measure slopes with a ruler. Check one cycle with a ruler after printing, and use the printer calibration if your printer stretches one direction. For lab notebooks, print several pages at once and number them so graphs can be referenced in the write-up.
Popular log graph paper sheets
Frequently asked questions
What is a cycle on log graph paper?
One cycle, also called a decade, covers a factor of ten, for example 1 to 10, 10 to 100 or 0.01 to 0.1. Within each cycle the lines for 2, 3, 4 and so on crowd closer together toward the top. Three-cycle paper therefore spans a range of 1,000 to 1 on that axis.
What is the difference between semi-log and log-log paper?
Semi-log paper has one logarithmic axis and one ordinary linear axis. It turns exponential growth or decay into a straight line. Log-log paper has logarithmic scales on both axes and turns power laws, such as y = ax², into straight lines whose slope is the exponent. See the semi-log and log-log pages.
How many cycles do I need?
Round your smallest value down to a power of ten and your largest up to one, then count the decades in between. Data from 4 to 700 fits between 1 and 1,000, so 3-cycle paper covers it; data from 3 to 2,500 needs 1 to 10,000, which is four cycles. More cycles fit a wider range but compress each one; with fewer cycles each decade gets more room and is easier to read.
Where is zero on log paper?
There isn't one. A logarithmic scale can only show positive values, because the log of zero is undefined. The bottom line of each axis is a power of ten that you choose, such as 1, 0.1 or 100, and you relabel the decade lines to match.
Can I change the labels to my own range?
The printed decade labels run 1, 10, 100, 1,000 and so on, which you can treat as relative markers. To start at a different power of ten, switch off Decade labels and write your own values, such as 0.01, 0.1 and 1, next to the bold lines.
What scale does the linear axis use on semi-log paper?
The horizontal axis is divided every 5 mm by default, with a bold line every fifth division, so bold lines fall every 25 mm. Change Linear division to fit your data, for example 1/4 inch per day or 10 mm per hour.
Last updated · About us