Variations
What prints with the starting settings
| Paper | US Letter — 215.9 × 279.4 mm (8.5 × 11 in) |
|---|---|
| Margins | 1/2″ |
| Line weight | 0.18 mm (bold 0.35 mm) |
| Print setting | Scale 100% / Actual size |
Power laws made straight
Some relationships multiply rather than add. Double a pendulum’s length and its period grows by about 1.41; double the frequency through a simple filter and the output falls by a fixed ratio. Plotted on linear graph paper these curves bend, and the exponent is hidden. On log-log paper, with logarithmic spacing on both axes, any relationship of the form y = a·xⁿ becomes a straight line, and its slope is the exponent n.
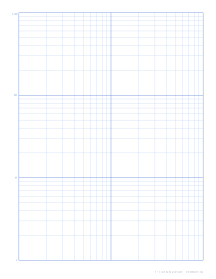
This sheet has three cycles on the vertical axis and two on the horizontal. Each cycle is divided at 2 through 9 with thin lines and closed by a heavier decade line, so you can locate values like 350 or 0.07 without calculation once the decades are labelled.
Choosing the cycle layout
Count how many powers of ten each variable covers. A frequency sweep from 10 Hz to 10 kHz covers three decades across; an amplitude falling from 1 to 0.01 covers two decades up. Match the paper to the data:
- 3 × 2 (default): a taller range of results against a narrower range of inputs.
- 3 × 3: wide-ranging data on both axes, such as particle sizes or animal body mass against metabolic rate.
- 2 × 2: bigger cycles that let you read values more precisely when the data covers only a hundredfold range.
- Landscape 2 × 3: frequency on the long axis, the usual shape for Bode-style plots.
Labelling the axes
Write your decade values beside the heavy lines before you plot. On the vertical axis the printed labels 1, 10, 100 and 1,000 can be read as any consecutive powers of ten, for example 0.001 to 1. On the horizontal axis there are no printed labels, so mark each heavy line yourself: 10 Hz, 100 Hz, 1 kHz for a frequency sweep, or 1 µm, 10 µm, 100 µm for a sieve analysis.
Getting accurate slopes
Because this generator fills the page, the cycles across and up are not exactly the same length. That does not affect where points go, but it does matter when you measure slope with a ruler, so convert each distance to “fractions of a cycle” first. Print at Actual size so the cycle lengths match the numbers above. If only one of your variables needs a log scale, use semi-log paper instead.
More log & semi-log sheets
Frequently asked questions
When should I use log-log paper instead of semi-log?
Use log-log when both variables span several powers of ten, or when you suspect a power law such as y = a·xⁿ. Semi-log is for exponential relationships, where only one variable grows by factors while the other steps evenly.
How do I read the exponent from a log-log graph?
Draw the best straight line and measure its slope with a ruler as rise over run in millimetres. Because the decades on the two axes are slightly different lengths, divide each distance by its own cycle length first. The ratio of the two results is the exponent n.
How big is each cycle?
On Letter the vertical cycles are about 82.7 mm tall and the horizontal cycles about 92.3 mm wide. On A4 they are about 90.3 mm and 92 mm.
Are both axes labelled?
The vertical axis carries decade labels 1, 10, 100 and 1,000. The horizontal axis is left for you to label, because frequency, size or time data rarely starts exactly at 1. Each heavier vertical line is ten times the one before.
What is log-log paper used for?
Frequency response and Bode magnitude plots, particle-size distributions, fatigue (S-N) curves, allometric scaling in biology, and the classic exercise of finding the exponent in Kepler's third law or a pendulum's period-length relationship.
Last updated · About us