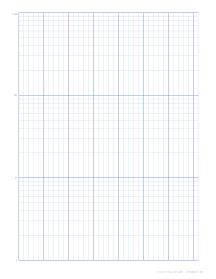
Why logarithmic spacing?
On ordinary graph paper, equal distances mean equal differences: the gap from 1 to 2 is the same as from 101 to 102. On a log scale, equal distances mean equal ratios: the gap from 1 to 2 is the same as from 10 to 20 or 100 to 200. That has two big advantages:
- Huge ranges fit on one page. Values from 1 to 1,000 take three equal cycles.
- Exponential and power-law data become straight lines, which are easy to draw, extrapolate and measure.
Cycles and labelling
Each cycle covers a factor of ten. Within a cycle the lines get closer together towards the top: the lines for 2, 3, 4 … 9 are spaced at log 2, log 3, … log 9 of the cycle’s length. The lines at the start of each cycle are the powers of ten.
You choose what the first cycle starts at. If your data runs from 0.5 to 300, label the cycle starts 0.1, 1, 10 and 100 and use four cycles. You cannot start at zero, since log 0 is undefined.
| Data range | Cycles needed | Label cycle starts |
|---|---|---|
| 2 to 80 | 2 | 1, 10 |
| 5 to 900 | 3 | 1, 10, 100 |
| 0.03 to 40 | 4 | 0.01, 0.1, 1, 10 |
Semi-log paper
One axis is logarithmic and the other linear. Use it when a quantity grows or shrinks by a constant percentage over time: bacteria doubling every hour, a radioactive sample halving every week, money at compound interest. Put time on the linear axis and the quantity on the log axis. If the points form a straight line, the growth or decay is exponential, and the line’s steepness tells you the rate.
Here is what that looks like with a quantity that doubles every step:
Linear axis
The early doublings are squashed flatLog axis (semi-log paper)
Every doubling is the same step: a straight lineOn the log axis each doubling climbs the same distance, about 0.3 of a cycle, because log 2 ≈ 0.301. Ten doublings make just over three cycles, since 2¹⁰ = 1,024.
Log-log paper
Both axes are logarithmic. Use it for power laws, where y = a·xⁿ: the area of a circle against its radius, the period of a pendulum against its length, or many relationships in physics and biology. On log-log paper these become straight lines, and the slope (measured in cycles, rise over run) equals the exponent n.
Plotting a point
- Find the cycle that contains the value: 450 lies between 100 and 1,000.
- Within that cycle, find the line for the leading digits: 450 is between the 4 and 5 lines of that cycle, halfway in value but slightly closer to the 5 line in distance, because the spacing shrinks as values rise.
- Mark the point and read it back to check.
For values between the printed lines, estimate carefully or use a log scale ruler. On a log axis, a small error in position means the same percentage error anywhere on the scale.
Printing log paper
The log graph paper generator prints semi-log and log-log sheets with one to five cycles per axis and the minor lines for each digit. Print at 100% / Actual size: although log paper is about ratios, a scaled printout still distorts slopes if the two axes are scaled differently by the printer.