Variations
What prints with the starting settings
| Paper | US Letter — 215.9 × 279.4 mm (8.5 × 11 in) |
|---|---|
| Margins | 1/2″ |
| Line weight | 0.18 mm (bold 0.35 mm) |
| Print setting | Scale 100% / Actual size |
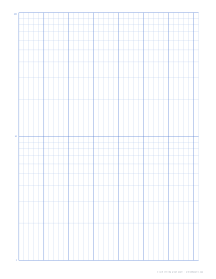
A sheet sized for the physics and chemistry lab
Two-cycle semi-log is the workhorse log paper in school and university labs. Its vertical axis covers two powers of ten, from 1 to 100 or any other hundredfold range, while the horizontal axis stays linear for time, temperature or distance. Exponential decay and growth plot as straight lines, so a half-life, time constant or growth rate can be read straight off the page.
With only two cycles sharing the height, each one is tall: about 124 mm on Letter. That makes the 2–9 subdivisions widely spaced, and you can estimate values between them with confidence. The decade lines are bold and labelled 1, 10 and 100 at the left; the linear axis has 5 mm divisions with a heavier line every 25 mm.
Setting it up for a report
- Name, date & class adds labelled fields at the top, so a graph detached from its report can still be matched up.
- 2 mm divisions suit experiments with many closely spaced readings.
- Landscape gives a longer time axis for runs with lots of readings; each cycle drops to about 92 mm tall.
Before plotting, relabel the decades to suit your data, write the quantity and unit on each axis, and give the graph a title. Your teacher will look for all three.
Reading values precisely
To read a value between the printed lines, remember that the spacing shrinks as you go up each cycle. Halfway between the 1 and 10 lines is not 5 but about 3.2. If you need an exact reading, measure the distance from the decade line in millimetres, divide by the cycle height, and raise ten to that power. It is a useful check when a teacher asks for values to two significant figures.
When two cycles aren’t enough
Check which decades your readings fall in. If they stay within two consecutive decades, such as 10 to 1,000, two cycles fit. If they touch a third, use the 3-cycle semi-log paper. If the independent variable also covers several decades, switch to log-log paper.
Print at Actual size; if your printer shrinks the page, the cycles shrink too and readings taken with a ruler will be off. Check one cycle against a ruler before handing it out to a class.
More log & semi-log sheets
Frequently asked questions
Why do lab reports use 2-cycle semi-log paper?
Many classroom experiments, such as radioactive decay with a school source, RC discharge or cooling curves, cover a range of roughly a hundredfold. Two cycles fit that range exactly, and each cycle is twice as tall as on four-cycle paper, so readings are more precise.
How tall is each cycle?
About 124 mm on Letter and 135.5 mm on A4 in portrait. Adding the header or switching to landscape makes each cycle shorter, since the same two decades share less height.
How do I find a half-life from this graph?
Plot your counts, draw the best straight line, and pick any value on it. Move up or down to half that value and read the time difference between the two points. On a straight line the result is the same wherever you start, which is a good check.
My data goes from 5 to 300. Will two cycles fit?
No, even though 300 is only 60 times 5. Decade lines sit at powers of ten, so 5 to 300 crosses three decades (1–10, 10–100 and 100–1,000). Use the 3-cycle semi-log paper instead. Data from 12 to 950, on the other hand, fits two cycles labelled 10, 100 and 1,000.
What does the 2 mm option change?
Only the linear axis. Divisions become 2 mm with a heavier line every 10 mm, like millimetre graph paper, which helps when your time readings are recorded to fine intervals.
Last updated · About us