Variations
What prints with the starting settings
| Paper | US Letter — 215.9 × 279.4 mm (8.5 × 11 in) |
|---|---|
| Margins | 1/2″ |
| Line weight | 0.18 mm (bold 0.35 mm) |
| Print setting | Scale 100% / Actual size |
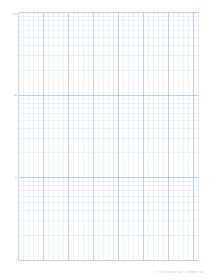
Exponential data as straight lines
On ordinary graph paper an exponential curve shoots off the top of the page or flattens into the x-axis, and comparing two such curves is guesswork. Semi-log paper fixes that by spacing one axis logarithmically. Equal distances up the page now stand for equal ratios, not equal differences, so a quantity that doubles every hour climbs in a straight line.
This sheet has three cycles up the vertical axis, each divided at 2 through 9 with thin lines and bounded by heavier decade lines. The decade lines carry labels 1, 10, 100 and 1,000 on the left. The horizontal axis is linear: 5 mm divisions with a bolder line every 25 mm, which suits time, distance, dose or any other evenly stepped variable.
Choosing cycles and orientation
Pick the number of cycles by counting the powers of ten your data touches. Readings from 4 to 700 sit in the decades 1–10, 10–100 and 100–1,000, so three cycles are enough. Data such as bacterial counts from 10 to 100,000 needs the 4-cycle version. If you only need a factor of ten or a hundred, use fewer cycles so each one is taller and easier to read; 2-cycle semi-log is the usual lab choice.
Landscape suits time series: the horizontal axis gets 49 divisions on Letter rather than 36, while the vertical cycles become shorter.
Common classroom uses
Biology students plot bacterial or yeast population counts against time; chemistry classes plot reaction rates or concentrations; economics and personal-finance lessons use it to compare compound interest at different rates. In each case the question is the same: is the line straight, and how steep is it? A bend in the line marks the point where growth changes, such as a culture reaching its stationary phase.
Plotting tips
Before you start, write your real decade values beside the printed ones and label the horizontal axis with units. Plot points with a sharp pencil, then fit a line with a clear ruler. Avoid zero and negative values; a log axis has no place for them. If both of your variables span several powers of ten, you need log-log paper instead.
Print at Actual size so cycles keep equal heights, and check by measuring one: about 82.7 mm on Letter.
More log & semi-log sheets
Frequently asked questions
What is semi-log graph paper used for?
Plotting anything that grows or shrinks by a constant factor over time: bacterial growth, radioactive decay, compound interest, capacitor discharge, drug concentration in blood. On semi-log paper those curves become straight lines, which makes the rate easy to read and outliers easy to spot.
What does "3 cycles" mean?
Each cycle (or decade) covers one factor of ten. Three cycles stacked up the vertical axis cover a thousandfold range, for example 1 to 1,000 or 0.1 to 100. On Letter each cycle is about 82.7 mm tall; on A4 about 90.3 mm.
How do I label the axis if my data doesn't start at 1?
Treat the printed labels as positions, not fixed values. The bottom line can be any power of ten; each heavier line above it is ten times the one below. Or choose the no-labels variation and write your own decades in.
Why are the lines inside each cycle unevenly spaced?
They mark 2, 3, 4 and so on up to 9 times the decade's starting value, placed at their logarithms. The gap from 1 to 2 is about 30% of the cycle, while 8 to 9 is only about 5%, which is exactly what makes multiplication look like addition on the page.
How do I find the growth rate from a straight line?
Read two points on the line, (t1, y1) and (t2, y2). The rate is ln(y2 / y1) ÷ (t2 − t1). If the line rises one full cycle over a time span T, the quantity multiplies by ten every T, so its doubling time is about 0.3 T.
Last updated · About us