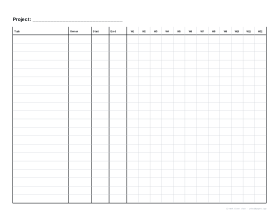
Why a Gantt chart helps
A to-do list tells you what needs doing; a Gantt chart tells you when, and how tasks fit together. You can see at a glance which tasks overlap, which weeks are overloaded and how a delay in one task pushes everything after it.
The chart is named after Henry Gantt, who designed and popularised it around 1910–1915, although the Polish engineer Karol Adamiecki had drawn a similar “harmonogram” in 1896. More than a century later, a sheet of paper and a pencil is still one of the quickest ways to plan a project.
Step 1: list the tasks
Write down everything the project needs, then group small jobs into tasks of a sensible size: for a twelve-week project, tasks of a few days to a few weeks. Write them in rough order down the left-hand column. The chart’s Task, Owner, Start and End columns let you note who is responsible and the planned dates.
Step 2: choose the time scale
Pick the template that fits: the weekly chart for most projects, the 30-day chart for events and sprints, the 12-month chart for long plans. Write dates or week numbers above the columns.
Step 3: draw the bars
For each task, shade from the start column to the end column. Use pencil at first, since plans change. Mark milestones (moments when something must be finished, like a launch or a deadline) with a diamond.
Step 4: add dependencies
Some tasks cannot start until another ends: you cannot paint a wall before plastering it. Draw an arrow from the end of one bar to the start of the next. The longest chain of dependent tasks is the critical path; any delay along it delays the whole project.
A worked example
Here is a small project, a school fair, planned week by week. Each task has a length and a list of tasks it must wait for. Working forwards gives each task its earliest start; working backwards from the finish gives the latest it can end; the difference is its slack.
- Critical path (no slack)
- Other tasks
- Slack: how late a task can finish without delaying the fair
| Task | Weeks | After | Earliest start | Finish | Slack |
|---|---|---|---|---|---|
| A. Book the hall | 1 | — | week 1 | end of week 1 | 0 |
| B. Recruit volunteers | 3 | A | week 2 | end of week 4 | 3 wk |
| C. Invite stallholders | 4 | A | week 2 | end of week 5 | 0 |
| D. Design posters | 2 | A | week 2 | end of week 3 | 4 wk |
| E. Print and put up posters | 1 | D | week 4 | end of week 4 | 4 wk |
| F. Floor plan and stall map | 2 | C | week 6 | end of week 7 | 0 |
| G. Volunteer briefing | 1 | B, F | week 8 | end of week 8 | 0 |
| H. Fair day | 1 | E, G | week 9 | end of week 9 | 0 |
Reading it is the useful part. Inviting stallholders, the floor plan, the volunteer briefing and the fair itself sit on the critical path: if stallholder invitations take an extra week, the fair moves a week. Recruiting volunteers has three weeks of slack and the posters four, so those can wait if the hall booking runs late, without risk to the date.
Finding the critical path on paper
- Write each task’s length and what it waits for in the Task column.
- Draw each bar starting at the end of the latest task it waits for.
- The task that ends last sets the project’s finish.
- Trace back from it: at each step, follow the task that ends exactly when the next one starts. That chain is the critical path; highlight it.
- Every other bar can move right until it touches the next task in its chain. That gap is its slack.
Step 5: check the load
Look down each column. If one week has too many bars, or one person owns several overlapping tasks, move something. It is far easier to fix on paper than in the middle of the project.
Tracking progress
Each week, colour in the part of each bar that is done, and draw a vertical line for today. Anything to the left of the line that is not coloured is behind schedule. Keep the detailed tasks for each week on a to-do list.
Keeping it simple
A paper Gantt chart works best with fewer than 30 tasks. If a project has more, make one chart for the phases and separate charts for the busiest phases.
Printing
Print landscape at 100% / Actual size; for a team wall chart, print on Tabloid or A3.