Reading the grid
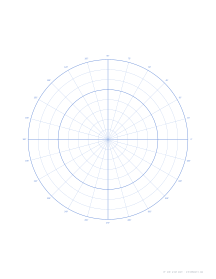
Polar graph paper has concentric circles around a centre point, called the pole, and straight rays coming out from it at regular angles. The circles measure distance, r, from the pole. The rays measure angle, θ, counted anticlockwise from the ray pointing right, which is 0°. A point such as (3, 60°) is three rings out along the 60° ray.
Degrees or radians
The same grid can be labelled in degrees (0° to 360°) or radians (0 to 2π). In radians, a quarter turn is π/2, a half turn π and a full turn 2π. Our degrees sheet labels the rays every 15° by default; the radians sheet labels them in fractions of π. Rays can be drawn every 5°, 10°, 15°, 30° or 45°.
Plotting a curve
To draw r = f(θ), make a small table: work out r for each ray angle, plot the points, then join them with a smooth curve. Some classic examples:
- Circle: r = 3 is a circle of radius 3 around the pole.
- Cardioid: r = 2 + 2cos θ makes a heart shape.
- Rose: r = 4cos 3θ has three petals; r = 4cos 2θ has four.
- Spiral: r = θ/30 (in degrees) winds outward one unit every 30°.
Here they are, computed and drawn on a polar grid:
- Circler = 3
- Cardioidr = 2 + 2 cos θ
- Three-petal roser = 4 cos 3θ
- Four-petal roser = 4 cos 2θ
- Spiralr = θ / 90°
A rose r = a cos nθ has n petals when n is odd and 2n petals when n is even, which is why cos 3θ gives three and cos 2θ gives four. A fine ray spacing such as 10° or 15° gives enough points for a smooth curve; 30° and 45° are better for simple diagrams.
Worked example: the cardioid
To plot r = 2 + 2 cos θ by hand, work out r on every 30° ray, mark each point, then join them with a smooth curve:
| θ | 0° | 30° | 60° | 90° | 120° | 150° | 180° | 210° | 240° | 270° | 300° | 330° |
|---|---|---|---|---|---|---|---|---|---|---|---|---|
| r | 4.00 | 3.73 | 3.00 | 2.00 | 1.00 | 0.27 | 0.00 | 0.27 | 1.00 | 2.00 | 3.00 | 3.73 |
The curve is widest at 0°, where r = 4, and touches the pole at 180°, where r = 0, giving the dimple of the heart shape. Because cos θ is symmetric, the values below the horizontal axis mirror the ones above, so you only need to calculate half of them.
Choosing ring spacing
Wider rings make plotting easier and suit classroom work and large curves. Closer rings fit more units on the page, useful when r grows large. Bold rings every five units help you count quickly.
Beyond maths
Polar paper is also useful for radial designs: mandalas, clock faces, dartboards, compass roses and circular charts. Artists use it to keep radial symmetry, and engineers use it for antenna patterns and anything measured by bearing and distance.
Converting between polar and Cartesian
A point (r, θ) in polar form is at x = r cos θ and y = r sin θ. Going the other way, r = √(x² + y²) and θ is the angle whose tangent is y/x, adjusted for the quadrant. Plotting the same point on both kinds of paper is a good way to check your conversions.
Printing
Print at 100% / Actual size so ring spacing stays exact. For curves in Cartesian form, use coordinate plane paper; the graph paper for maths guide compares grids for every topic.